Comparative Economic Development in Landlocked Nations: A Case Study of Nepal, Bhutan, and Laos
· 12 min read
Written for SS164: Global Development and Applied Economics, Minerva University, February 2025
Introduction
Lack of territorial access to the sea, isolation from world markets, and high transit costs constrain the socio-economic development of landlocked developing countries (United Nations, n.d.). Nepal, Bhutan, and Laos share mountainous geography and resource-based economies. Yet differences in policy choices, historical trajectories, and even in how each country measures itself (Nepal’s Living Standards Survey, Bhutan’s Gross National Happiness index, and the Lao Expenditure and Consumption Survey) produce different outcomes in economic performance and social progress.
This paper aims to:
- describe the current economic and social conditions in each country;
- compare their growth trajectories and development strategies; and
- evaluate these trends within standard economic frameworks to suggest directions for policy.
The headline numbers used in the paper are collected here.
| Indicator | Nepal | Bhutan | Laos |
|---|---|---|---|
| GDP per capita (current US$) | 1,377 | 3,711 | 2,066 |
| Life expectancy at birth (years) | 70 | 72 | 68 |
| Adult literacy (% aged 15+) | 71 | 72 | 88 |
| Literacy, rural vs urban (%) | 62 vs 84 | 62 vs 82.1 | 48 vs 91 |
| Gini coefficient | 0.34 | 0.28 | 0.38 |
Table 1. Summary indicators. Sources are given where each figure is discussed below.
The three countries
Nepal
Nepal is a landlocked nation in South Asia bordered by two of the world’s most populous countries, India and China. Its topography runs from the Himalayas to the subtropical lowlands of the Terai. Historically ruled by monarchs and Rana prime ministers, Nepal is now a federal democratic republic. India has the larger cultural, economic, and political influence because of the open border and flat terrain between the two countries. China is an increasingly important partner in trade and infrastructure, but the relationship is constrained by the Himalayas and the Tibetan Plateau. Nepal’s economy depends on remittances, agriculture, and tourism, with hydropower emerging as a potential growth sector.
Bhutan
Bhutan is a small landlocked Himalayan kingdom, also bordered by India and China. It is mostly mountainous with deep valleys. It was an absolute monarchy for much of its history and became a constitutional monarchy in 2008. It uses Gross National Happiness (GNH) as its guiding development philosophy, emphasising sustainability, cultural preservation, and equitable socio-economic progress.
Laos
Laos is a landlocked socialist republic in Southeast Asia, bordering Thailand, Vietnam, Cambodia, Myanmar, and China. Its geography combines mountainous regions with the Mekong River basin. It relies on hydropower and mining, alongside growing regional trade, to drive development. Laos has experienced significant foreign influence, from France during the colonial era and later from the United States during the Vietnam War.
Colonisation
Nepal. Nepal was never colonised, but it fought the Anglo-Nepalese War (1814–1816) and lost about one-third of its territory under the Treaty of Sugauli with the British East India Company. It kept its sovereignty but remained politically isolated under the Rana dynasty, which restricted education to the elite.
Bhutan. Bhutan kept its independence through strategic diplomacy and avoided direct colonial rule. It did negotiate treaties with British India to manage border and trade relations.
Laos. Laos was under French colonial influence from approximately 1887 to 1945, as part of French Indochina. The colonial period left administrative and cultural legacies, and later geopolitical conflict brought extensive bombing by the United States during the Vietnam War. More bombs were dropped on Laos by the US than were used in the whole of the Second World War (BBC, 2018).
GDP
The GDP per capita of Bhutan, Laos, and Nepal is US$3,711, US$2,066, and US$1,377 respectively. Bhutan is doing remarkably well given its similar geography, which may be due to its fairly stable institutions, discussed below. The first question, though, is whether these numbers are a true reflection of the economies.
GDP is calculated as (US Department of Commerce, n.d.):
GDP = C + I + G + (X − M)
where C is consumer spending, I is investment, G is government spending, and X − M is net exports (exports minus imports).
Nepal’s GDP estimate draws on the national population and housing census, the agriculture sample survey, the living standards survey, and the survey of manufacturing establishments, but it relies mostly on estimates (World Bank, 2021). Government spending and investment are comparatively easy to measure. Consumer spending and net exports are not.
Net exports in particular are imprecise. Most of Nepal’s consumers live in the south (Figure 1), and many shop across the open border with India without passing through customs (The Kathmandu Post, 2023).
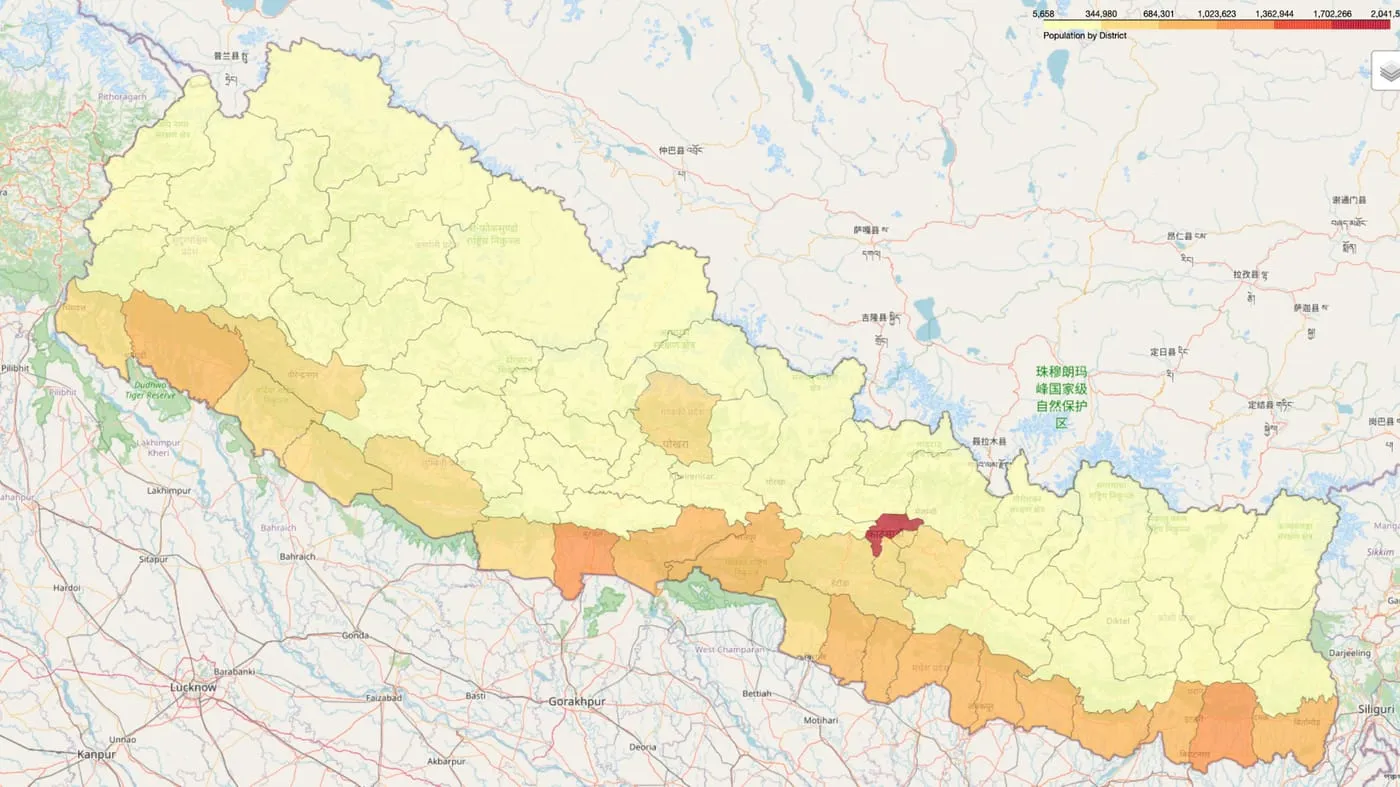
Figure 1. Nepal’s population is concentrated in the southern districts along the Indian border. District populations from Nepal’s 2021 census, drawn on GADM boundaries. Base map © OpenStreetMap contributors.
I do not repeat this measurement analysis for Bhutan and Laos.
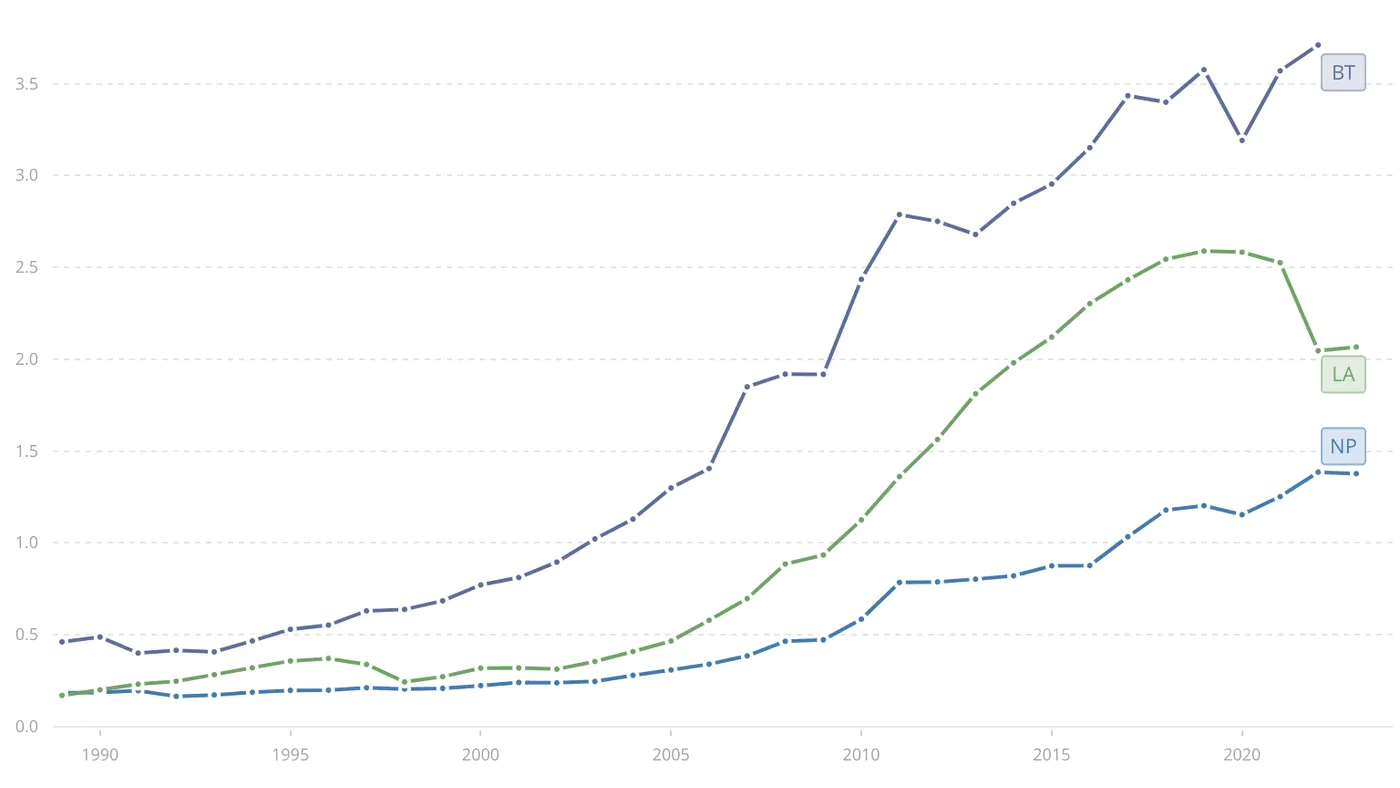
Figure 2. GDP per capita of Nepal (NP), Laos (LA), and Bhutan (BT) in current US dollars, 1990–2023. The vertical axis is in thousands of dollars. Source: World Bank.
Development indicators
Health and education measure dimensions of well-being that GDP cannot.
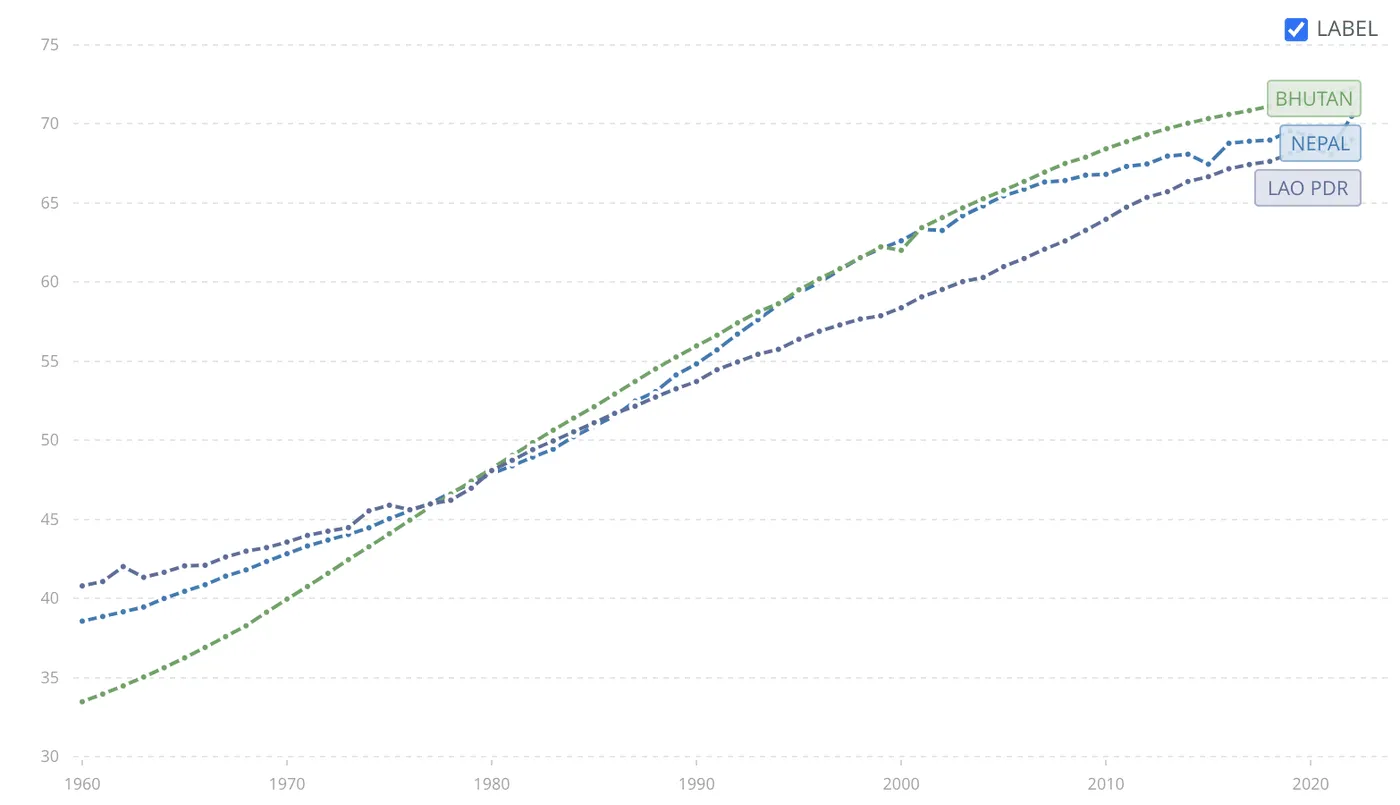
Figure 3. Life expectancy at birth (years) for Bhutan, Nepal, and Lao PDR, 1960–2022. Adapted from World Bank (2022).
Life expectancy in Laos, Nepal, and Bhutan is 68, 70, and 72 years respectively (World Bank, 2022). Bhutan and Laos switched rankings around 1980, which is likely related to the after-effects of US bombing and the communist takeover of Laos in 1975 (BBC, 2018).
Education, measured by literacy and school life expectancy, is another critical indicator. Adult literacy (the share of people over 15 who are literate) is 71% in Nepal, 72% in Bhutan, and 88% in Laos (World Bank, 2024). A person counts as literate if they can read and write, with understanding, a short simple statement about their everyday life (Macro Trends, n.d.). Laos does surprisingly well. But its urban–rural divide is extreme: 48% of rural citizens are literate against 91% in urban areas (World Bank, n.d.). The gap is narrower in Nepal, 62% against 84%, and in Bhutan, 62% against 82.1% (Dhakal, 2018; Bhutan Living Standards Survey, 2022).
These figures come from surveys in which people report their own literacy. They also say nothing about the distribution of education levels, formal or informal.
Inequality and distribution
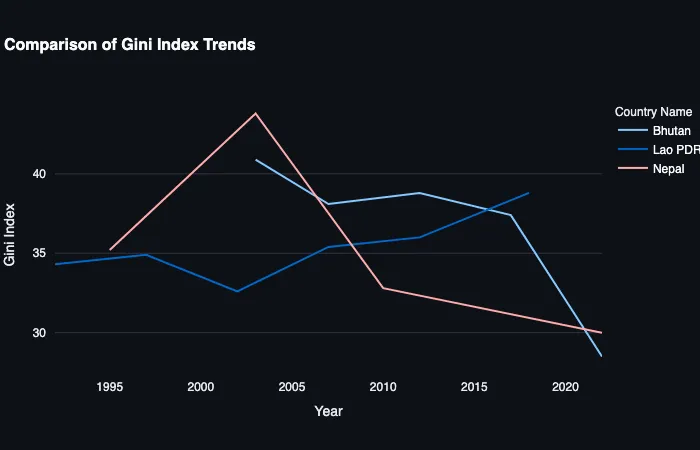
Figure 4. Gini index for Bhutan, Lao PDR, and Nepal, 1995–2020. Data: World Development Indicators.
The Gini coefficients of Nepal, Bhutan, and Laos are 0.34, 0.28, and 0.38 respectively (Figure 4). Nepal and Bhutan show large changes over time, but inequality is not measured often in these countries: there are only four to six data points per country in the graph. Vertical inequality (the overall income distribution) is low in Bhutan, but its mountainous geography leaves room for horizontal inequality between regions.
In Nepal, the differences among the three main ecological belts (the mountains, the mid-hills, and the Terai lowlands) are stark. Communities in remote mountain districts often have limited access to roads, schools, and healthcare, which leads to lower incomes and poorer social outcomes (Nepal Rastra Bank, 2024).
In Laos, industrial and commercial activity is concentrated in the Mekong corridor, which has higher incomes and better infrastructure. Ethnic minority communities in the northern highlands often rely on subsistence agriculture with limited access to markets, and have lower average incomes (Lao Statistics Bureau & World Bank, 2020).
Bhutan’s GNH framework seeks to reduce both vertical and horizontal inequality through targeted social policies in health, education, and local infrastructure. Rural regions, particularly in eastern Bhutan, still have less access to markets and public services than the capital region around Thimphu. GNH initiatives have narrowed some gaps, for example in rural electrification and schooling, but rural populations still struggle to find well-paid jobs, partly because industry is not diversified.
Institutions
Laos is a socialist republic governed by the Lao People’s Revolutionary Party. Its single-party system centralises authority, with a President as head of state and a Prime Minister running day-to-day government. Laos is open to foreign investment, but its political framework remains tied to socialist ideology and the state is prominent in key industries, which limits the advantages of a competitive free market.
Bhutan was historically an absolute monarchy and became a constitutional monarchy in 2008. The King remains highly respected, but power is shared with an elected parliament made up of a National Assembly and a National Council. Bhutan’s institutions emphasise a “middle path” of cultural and environmental preservation alongside cautious economic growth.
Nepal became a democratic republic in 2008, after a ten-year Maoist conflict and the end of a centuries-old monarchy. The federal structure divides the country into provinces, each with its own assembly, while a federal parliament (a House of Representatives and a National Assembly) legislates nationally. Political power is shaped by coalition governments, as multiple parties compete for leadership and ministerial positions.
Neighbours
All three are landlocked developing countries (UN, n.d.). Nepal and Bhutan share one critical neighbour, India, because mountainous terrain limits their trade with China. Their economies are tied to India for access to international markets, transit infrastructure, and a steady flow of imported goods.
The UN Convention on the Law of the Sea (1982) requires coastal neighbours to allow landlocked states transit through their territory to reach the sea for trade. Despite this, in 2015 India unofficially blocked almost all exports to Nepal, sending prices up and creating shortages of basic necessities (Knowler, 2016). Historical and cultural ties deepen the dependency: India is not just a trading partner but a major factor in the overall economic stability of both countries.
Laos, though also landlocked, has a more diverse set of neighbours: Thailand, Vietnam, Cambodia, Myanmar, and a more accessible China. It does not depend on a single country for its trade routes.
Reading the differences through economic models
Economic growth and the Solow model
The Solow model, which focuses on capital accumulation, technological progress, and labour growth, helps explain the different growth rates. Rapid infrastructure investment and booming exports have pushed Laos’s GDP growth to around 7% (Moody’s Analytics, 2024). Nepal’s growth is a more moderate 3.9%, driven largely by remittances that fuel consumer spending (World Bank, 2024). Bhutan prioritises qualitative well-being through its GNH index and has achieved sustainable but moderate growth (ADB, 2024).
Dual-sector and structural transformation models
In the Lewis dual-sector model, structural transformation happens as labour moves from agriculture to modern services and industry. Nepal’s urban migration and growing investment in sectors like hydropower signal this change (Nepal Rastra Bank, 2024). Laos is transforming faster through heavy investment in mining and hydropower, though this has not always produced broad-based development. Bhutan’s GDP per capita growth, from about US$400 in 1980 to US$2,800 in 2016 (IMF, 2018), reflects its emphasis on equitable social outcomes through the GNH framework, despite some urban–rural disparities.
Institutional economics and endogenous factors
Institutional quality shapes economic trajectories. Bhutan’s stable shift to constitutional monarchy has enabled effective implementation of GNH policy and inclusive growth. Nepal’s turbulent history, from the Rana regime to a prolonged Maoist conflict, has brought periodic instability that affects investor confidence and regional equity (World Bank, 2024). Laos’s centralised governance under the Lao People’s Revolutionary Party, shaped by its colonial and conflict-ridden past (BBC, 2018), has delivered rapid short-term growth but raises concerns about long-term inequality and uneven service delivery (ADB, 2024).
Exogenous influences
Geography and history also matter. Nepal’s position between India and China brings high transit costs and a heavy reliance on remittances, which shape consumer spending and investment patterns (The Kathmandu Post, 2023). Bhutan’s careful diplomacy, rooted in its historical treaties with British India, has let it manage modernisation while preserving sovereignty. Laos’s integration into the global economy has been deeply influenced by its colonial past and by Vietnam War-era bombing, which disrupted development and was followed by later investment in infrastructure and hydropower (BBC, 2018).
Conclusion
GDP per capita is a useful snapshot of overall economic performance, but explaining why Nepal, Bhutan, and Laos have diverged takes more: the Solow growth model, the Lewis dual-sector model, and institutional economics each account for part of it. Exogenous factors (geography, historical conflict, colonial legacies) and endogenous ones (institutional quality, human capital, structural transformation) have jointly shaped these countries’ paths (World Bank, 2024; ADB, 2024).
The comparison shows that countries facing the same challenge of landlockedness can end up in markedly different places because of differences in policy implementation, institutional stability, and even measurement. Nepal’s reliance on remittances, Bhutan’s holistic approach through Gross National Happiness, and Laos’s rapid but uneven growth each call for tailored policy. Future research should refine survey techniques to capture disparities within countries and to assess more accurately the long-term effect of economic reforms on inclusive growth.
Notes
Use of AI. I used Gemini to generate some of the code for the graphs and to paraphrase sentences to reduce the word count.
References
Asian Development Bank. (2024). Asian Development Outlook April 2024. https://www.adb.org/publications/asian-development-outlook-april-2024
BBC. (2018, January 9). Laos profile - timeline. Retrieved February 15, 2025, from https://www.bbc.com/news/world-asia-pacific-15355605
Bhutan Living Standards Survey. (2022). https://www.nsb.gov.bt/wp-content/uploads/dlm_uploads/2023/01/METADATA-ON-2022-BLSS.pdf
Dhakal, B. (2018). Literacy rate in rural and urban area [Table]. https://www.researchgate.net/figure/Literacy-rate-in-Rural-and-Urban-Area_tbl4_335107114
International Monetary Fund. (2018). Bhutan: 2018 Article IV Consultation (IMF Country Report No. 18/300). https://www.imf.org/en/Publications/CR/Issues/2018/10/30/Bhutan-2018-Article-IV-Consultation-Press-Release-Staff-Report-and-Statement-by-the-46319
Knowler, G. (2016). Nepal-India border blockade brings trade to a halt. Journal of Commerce. https://www.joc.com/article/nepal-india-border-blockade-brings-trade-to-a-halt-5233384
Lao Statistics Bureau & World Bank. (2020). Poverty Profile in Lao PDR: Poverty Report for the Lao Expenditure and Consumption Survey 2018–2019. https://www.worldbank.org/en/country/lao/publication/lao-pdr-poverty-profile-and-poverty-assessment-2020
Macro Trends. (n.d.). Nepal Literacy Rate 1981-2025. Retrieved February 1, 2025, from https://www.macrotrends.net/global-metrics/countries/npl/nepal/literacy-rate
Moody’s Analytics. (2024). Laos economic outlook. Moody’s.
Nepal Rastra Bank. (2024). Annual Report 2023/24. https://www.nrb.org.np/contents/uploads/2025/07/Annual-Report-2023-24-English.pdf
The Kathmandu Post. (2023, July 19). Border shoppers moan at end of duty-free system. https://kathmandupost.com/money/2023/07/19/border-shoppers-moan-at-end-of-duty-free-system
UN. (1982). United Nations Convention on the Law of the Sea. Retrieved February 1, 2025, from https://www.un.org/depts/los/convention_agreements/texts/unclos/unclos_e.pdf
UN. (n.d.). About Landlocked Developing Countries. Retrieved February 16, 2025, from https://www.un.org/en/landlocked/about-landlocked-developing-countries
United Nations. (n.d.). About Landlocked Developing Countries. Office of the High Representative for the Least Developed Countries, Landlocked Developing Countries and Small Island Developing States. Retrieved February 14, 2025, from https://www.un.org/ohrlls/content/about-landlocked-developing-countries
US Department of Commerce. (n.d.). What is GDP? Bureau of Economic Analysis. Retrieved February 14, 2025, from https://www.bea.gov/system/files/2020-04/GDP-Education-by-BEA.pdf
World Bank. (2021). World Bank technical assistance improves measurement of Nepal’s GDP. https://blogs.worldbank.org/en/opendata/world-bank-technical-assistance-improves-measurement-nepals-gdp
World Bank. (2022). Life expectancy at birth, total (years) [Data]. World Development Indicators. https://data.worldbank.org/indicator/SP.DYN.LE00.IN?locations=NP-BT-LA
World Bank. (2024). World Development Indicators [Data]. https://data.worldbank.org
World Bank. (n.d.). Health [Data]. https://data.worldbank.org/topic/health?locations=NP-BT-LA&type=shaded
World Bank. (n.d.). Laos country spotlight. https://www.iccwtnispcanarc.org/upload/pdf/7547113514Girls%20from%20enthnic%20minorities%20-laos_spotlight.pdf